OHDSI offers a wide range of open-source tools to support various data-analytics use cases on observational patient-level data. What these tools have in common is that they can all interact with one or more databases using the Common Data Model (CDM). Furthermore, these tools standardize the analytics for various use cases. Rather than having to start from scratch, an analysis can be implemented by filling in standard templates. This makes performing analyses easier, and also improves reproducibility and transparency. For example, there appear to be a near-infinite number of ways to compute an incidence rate, but these can be specified in the OHDSI tools with a few choices, and anyone making those same choices will compute incidence rates the same way.
Several OHDSI tools are described below.
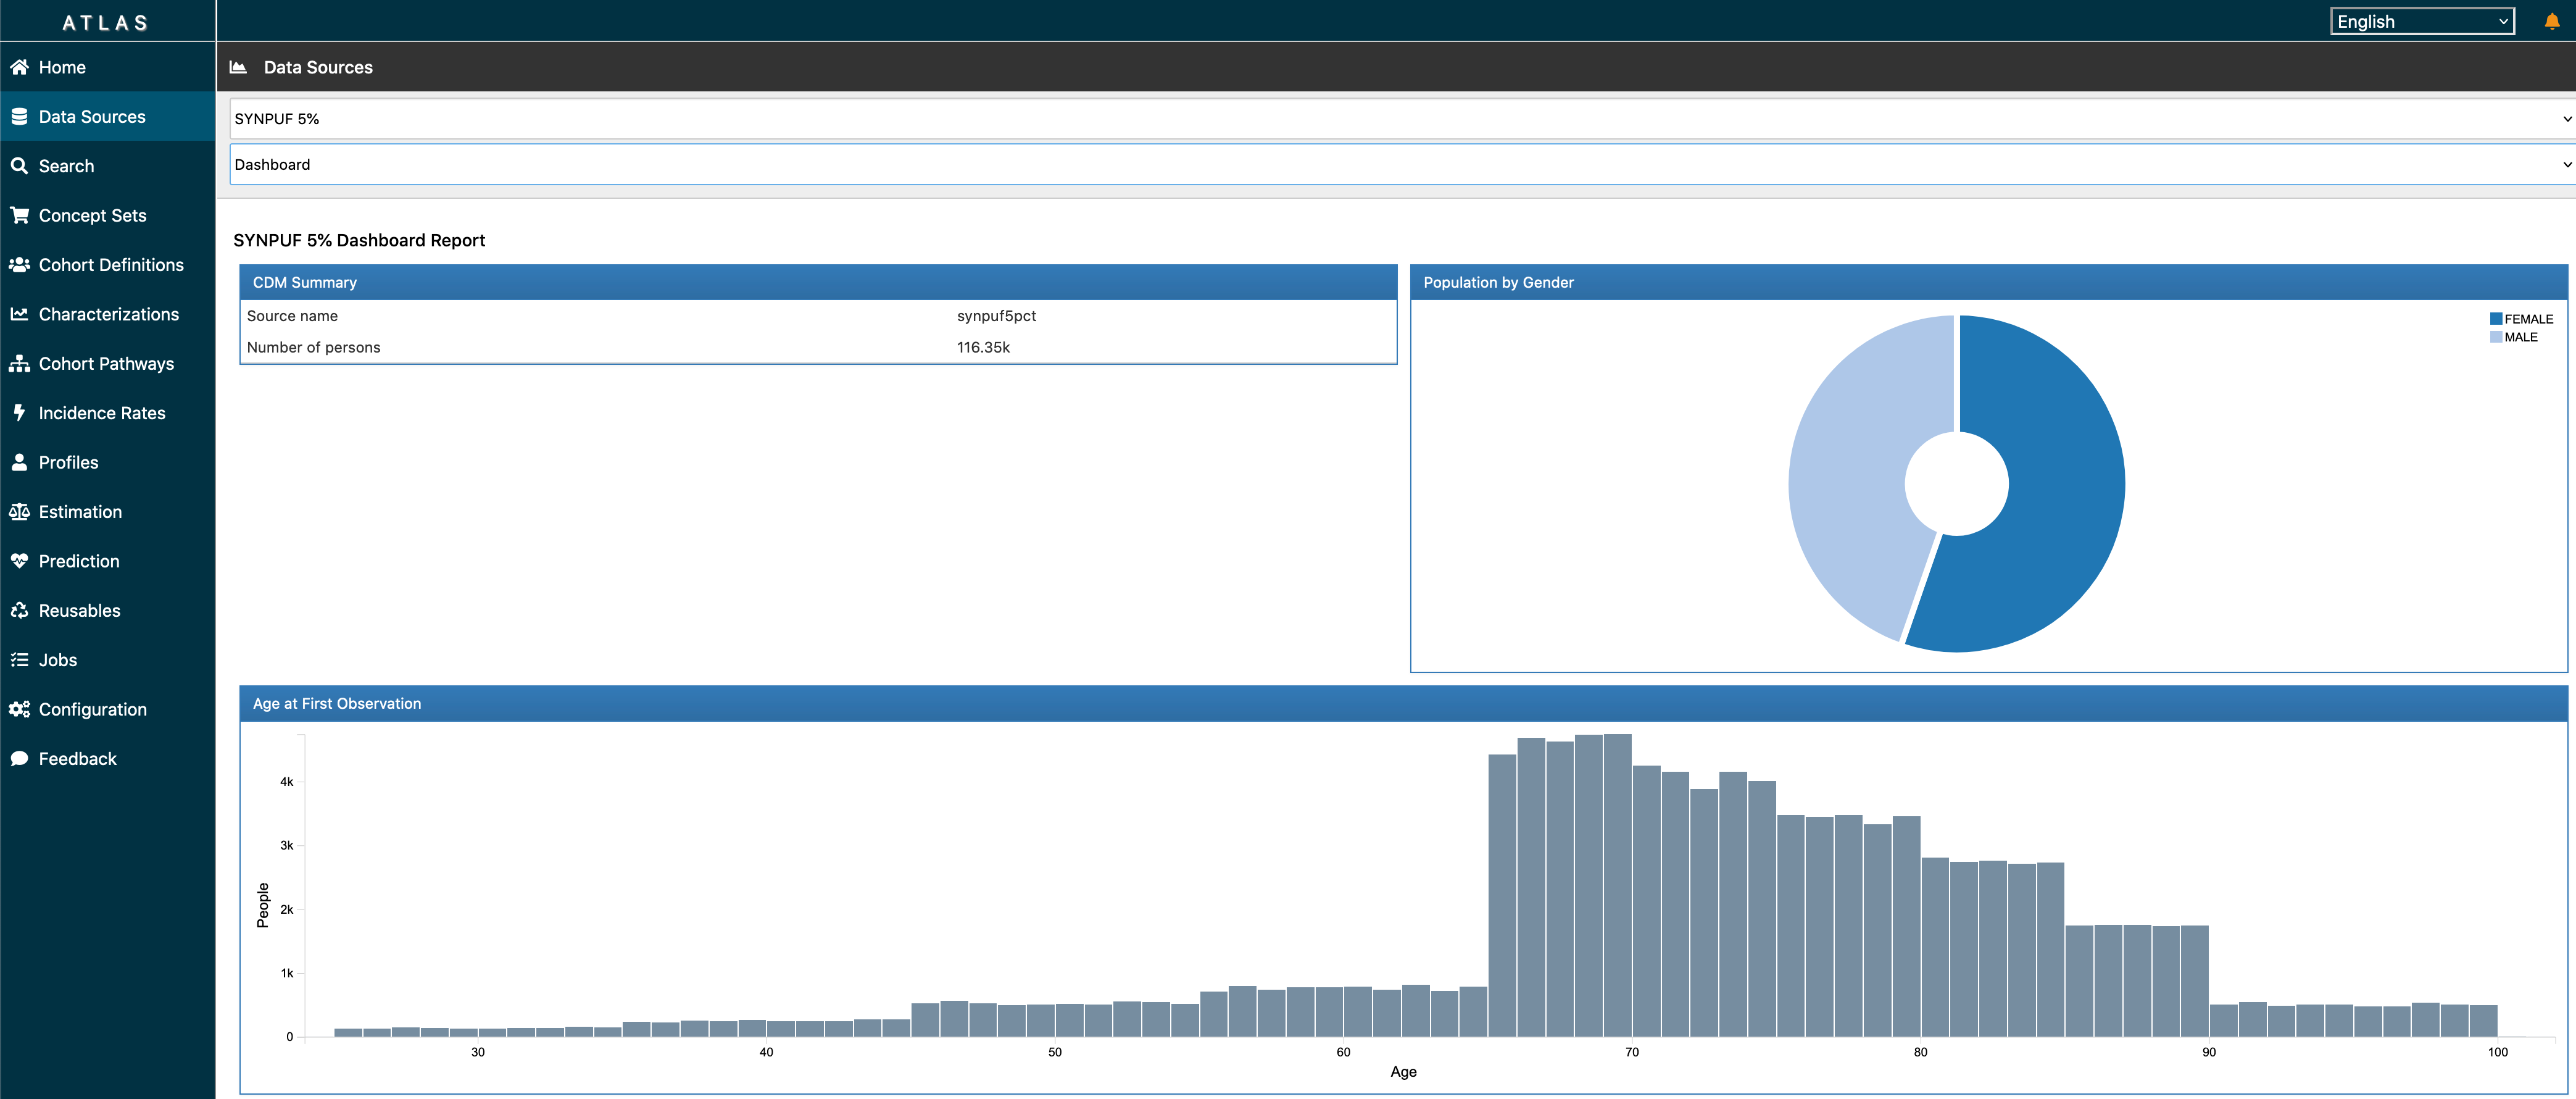 ATLAS is a free, publicly available, web-based tool developed by the OHDSI community that facilitates the design and execution of analyses on standardized, patient-level, observational data in the CDM format. ATLAS is deployed as a web application in combination with the OHDSI WebAPI. Performing real-time analyses requires access to the patient-level data in the CDM and is therefore typically installed behind an organization’s firewall. However, there is a public ATLAS, and although this ATLAS instance only has access to a few small simulated datasets, it can still be used for many purposes including testing and training. It is even possible to fully define an effect estimation or prediction study using the public instance of ATLAS, and automatically generate the R code for executing the study. That code can then be run in any environment with an available CDM without needing to install ATLAS and the WebAPI.
ATLAS LINKS
Documentation: Book of OHDSI • ATLAS Wiki (includes YouTube tutorials)
Demo: Click Here
Installation Information: Click Here
Source Code: GitHub
“10-Minute Tutorial” Video on Creating Cohort Definitions in ATLAS: Click Here
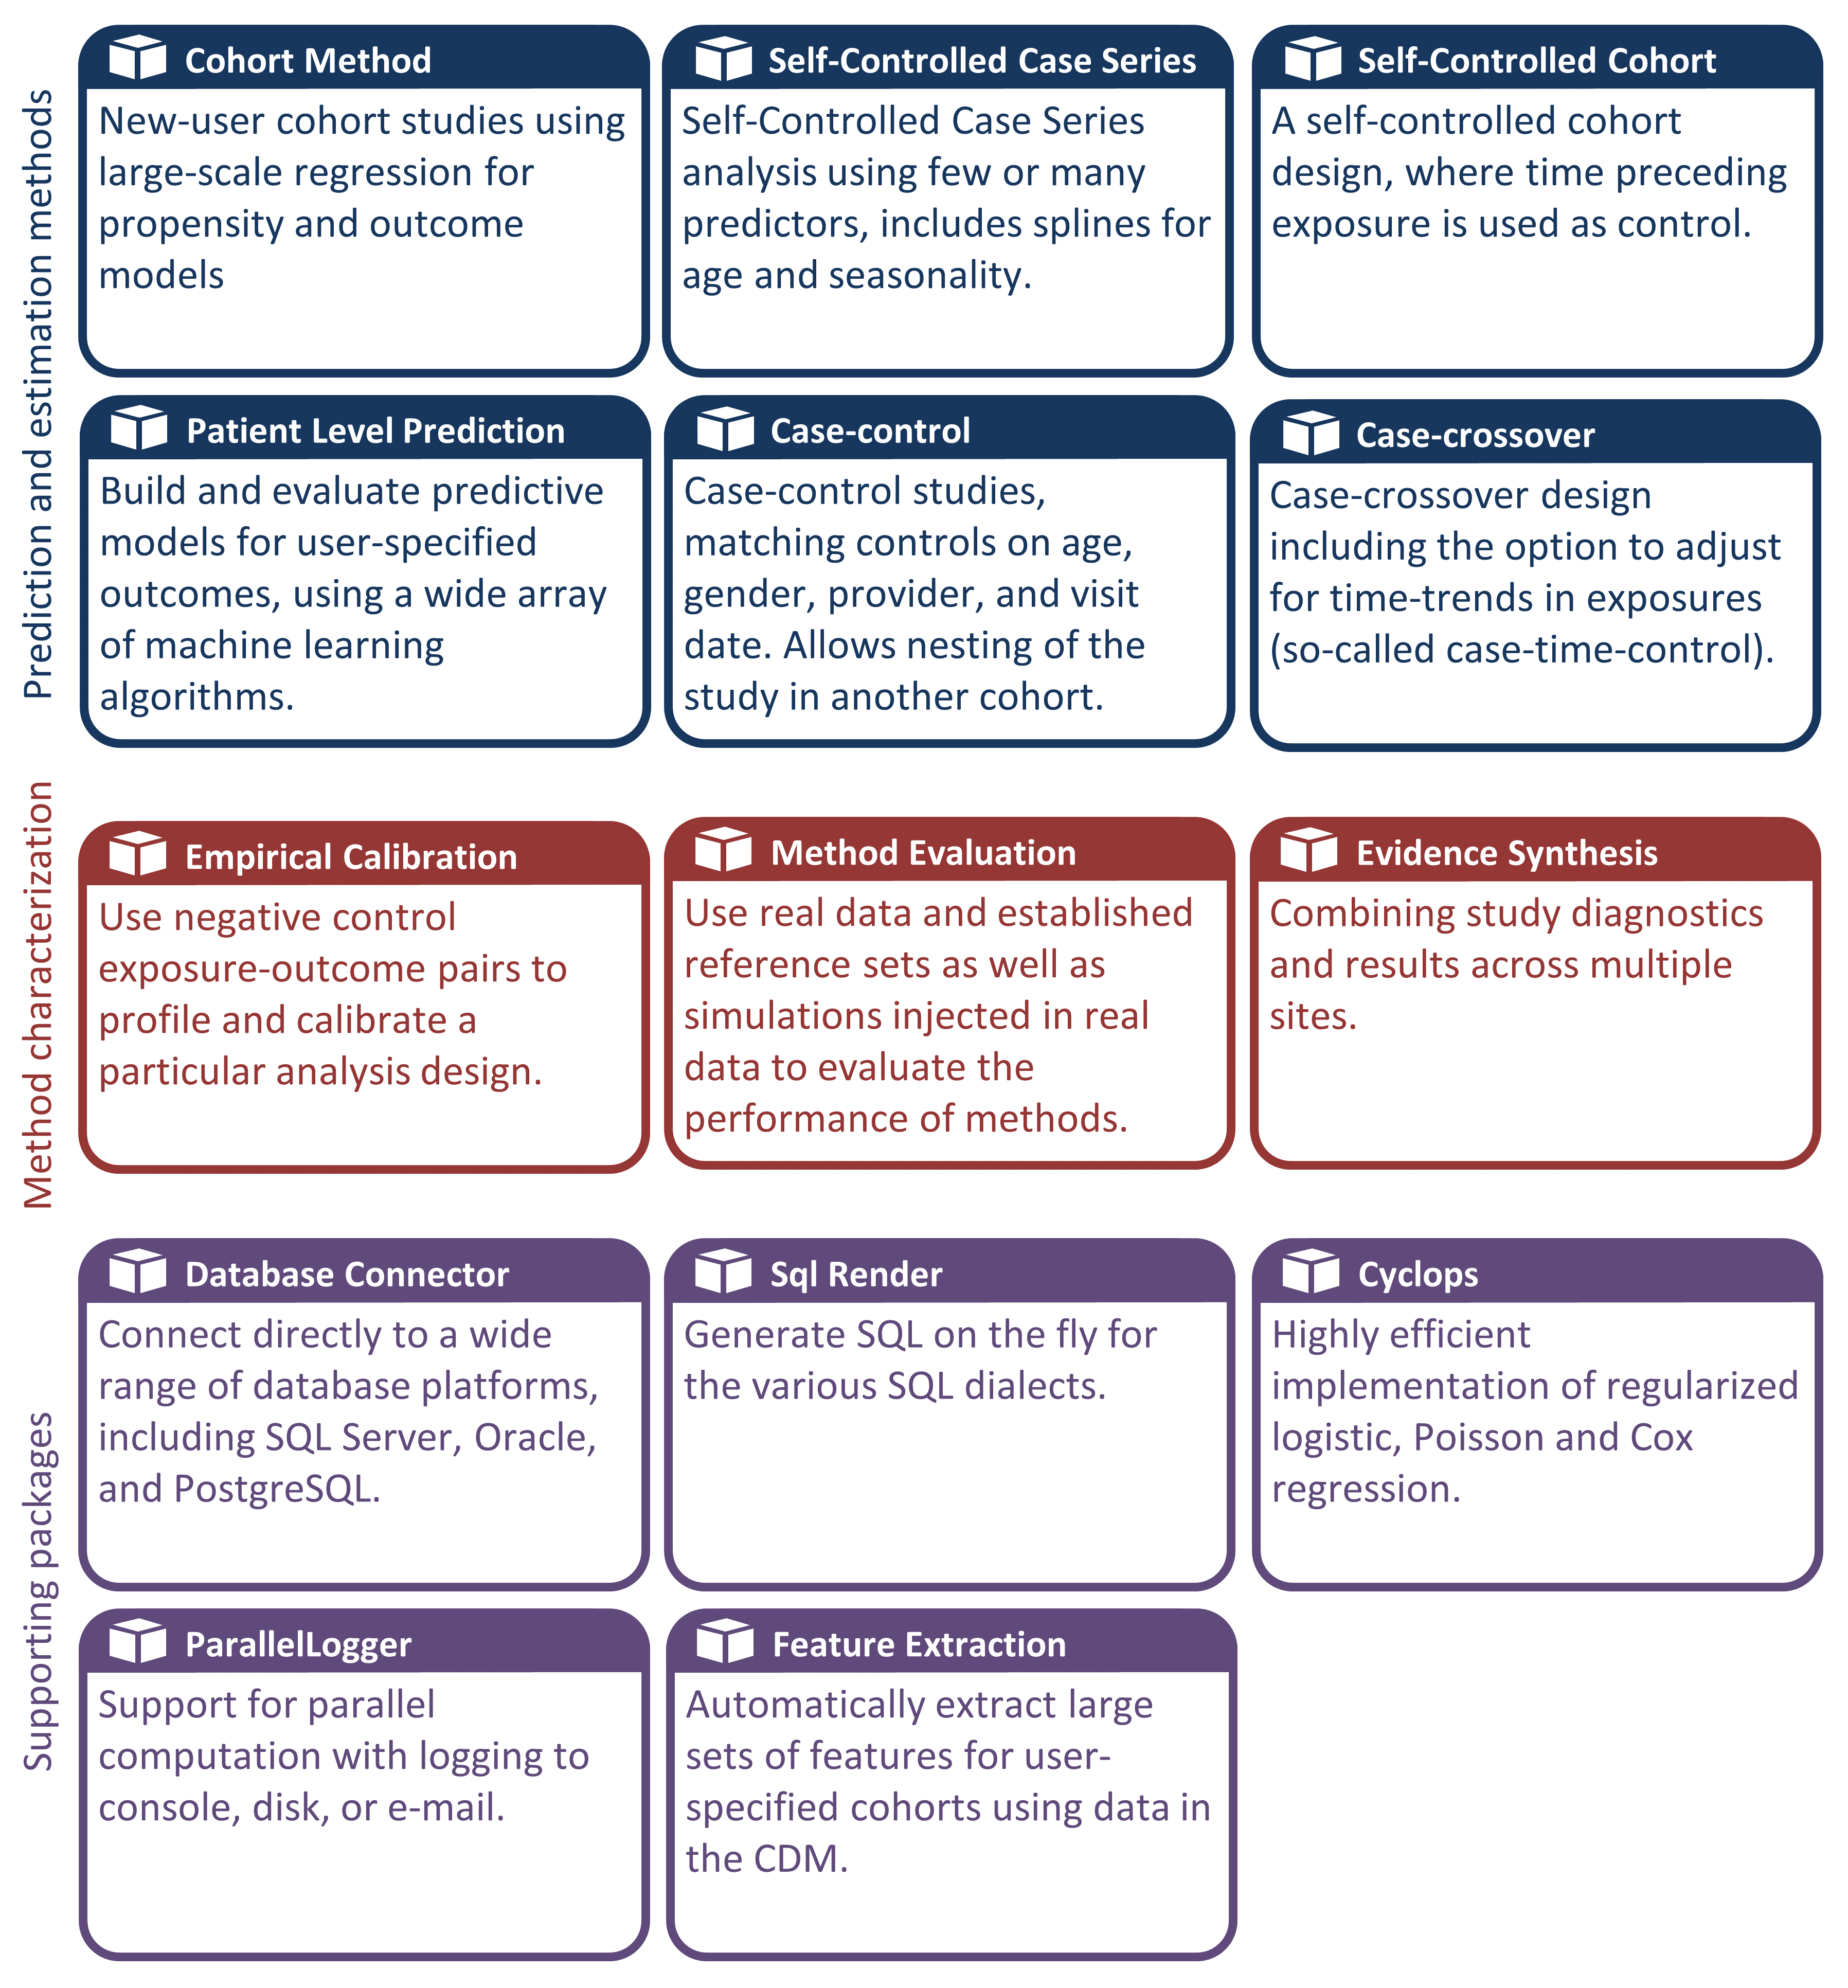 HADES (previously the OHDSI METHODS LIBRARY) is a collection of open-source R packages that offer functions which can be used together to perform a complete observational study, starting from data in the CDM, and resulting in estimates and supporting statistics, figures, and tables. The packages interact directly with observational data in the CDM, and can be used simply to provide cross-platform compatibility to completely custom analyses, or can provide advanced standardized analytics for population characterization, population-level effect estimation, and patient-level prediction. HADES supports best practices for use of observational data and observational study design as learned from previous and ongoing research, such as transparency, reproducibility, as well as measuring the operating characteristics of methods in a particular context and subsequent empirical calibration of estimates produced by the methods.
HADES LINKS
Documentation: Book of OHDSI • HADES Web Site
Installation Information: Click Here
Source Code: GitHub
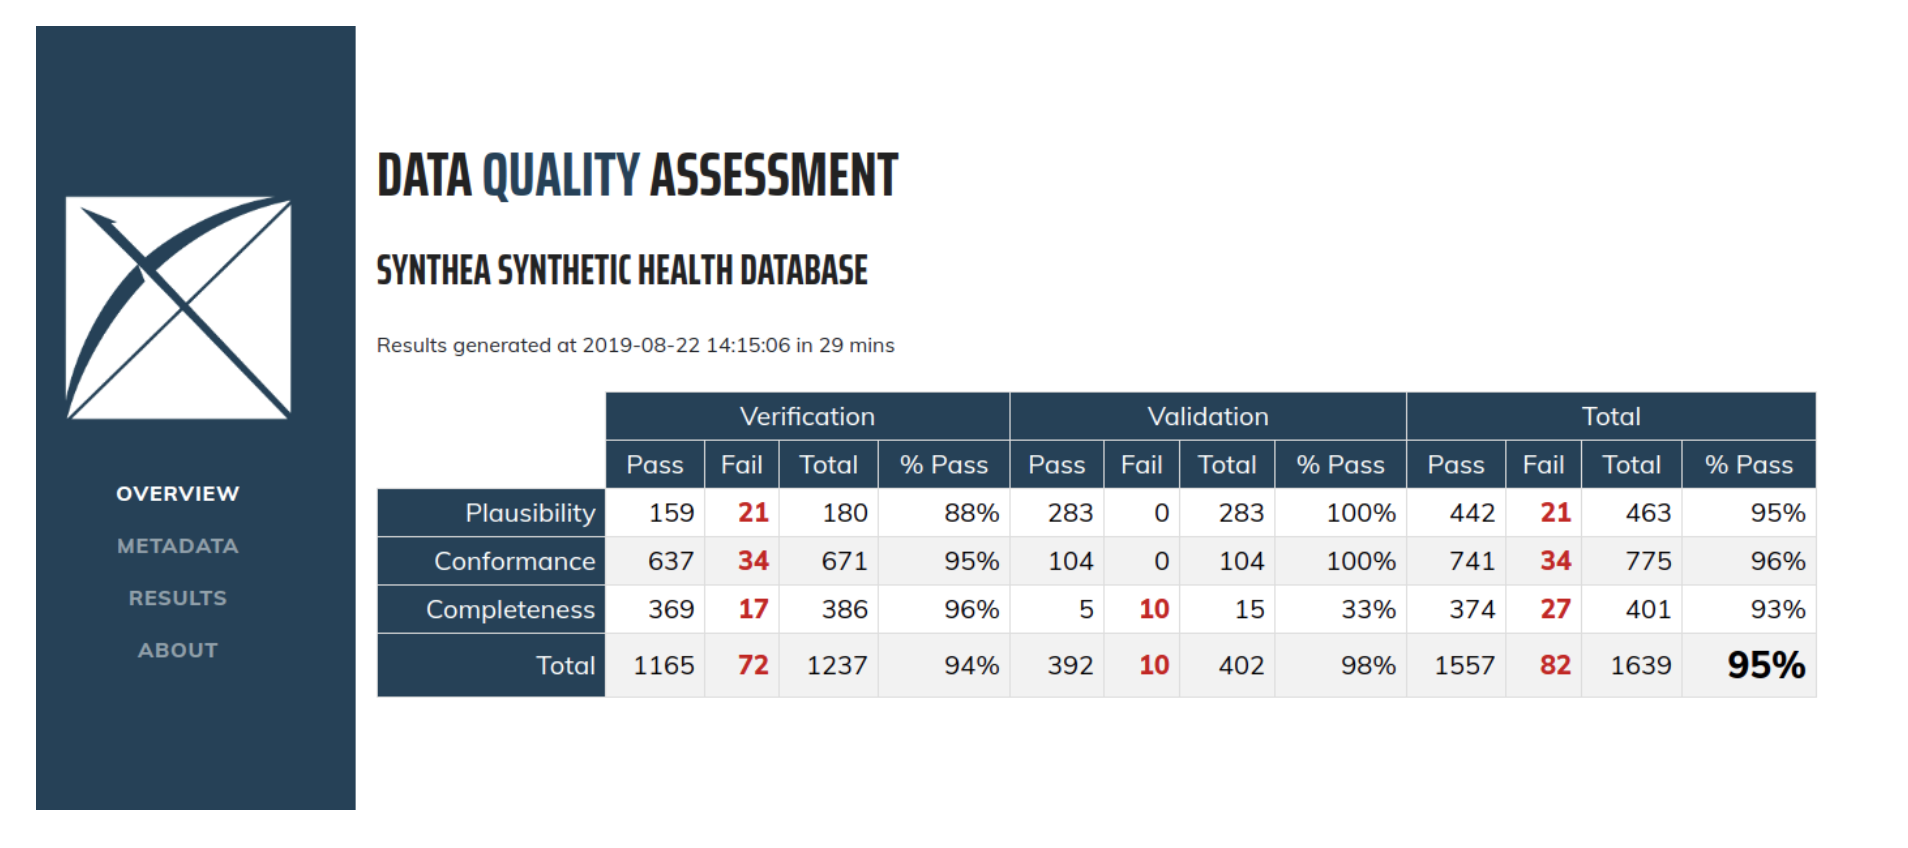 DATA QUALITY DASHBOARD applies a harmonized data quality assessment terminology to data that has been standardized in the OMOP Common Data Model. Where ACHILLES runs characterization analyses to provide an overall visual understanding of a CDM instance, the DQD goes table by table and field by field to quantify the number of records in a CDM that do not conform to the given specifications. In all, over 1,500 checks are performed, each one organized into the Kahn framework. For each check, the result is compared to a threshold whereby a FAIL is considered to be any percentage of violating rows falling above that value.
DATA QUALITY DASHBOARD LINKS
Documentation: Book of OHDSI
Demo: Click Here
Installation Information: Click Here
Source Code: GitHub
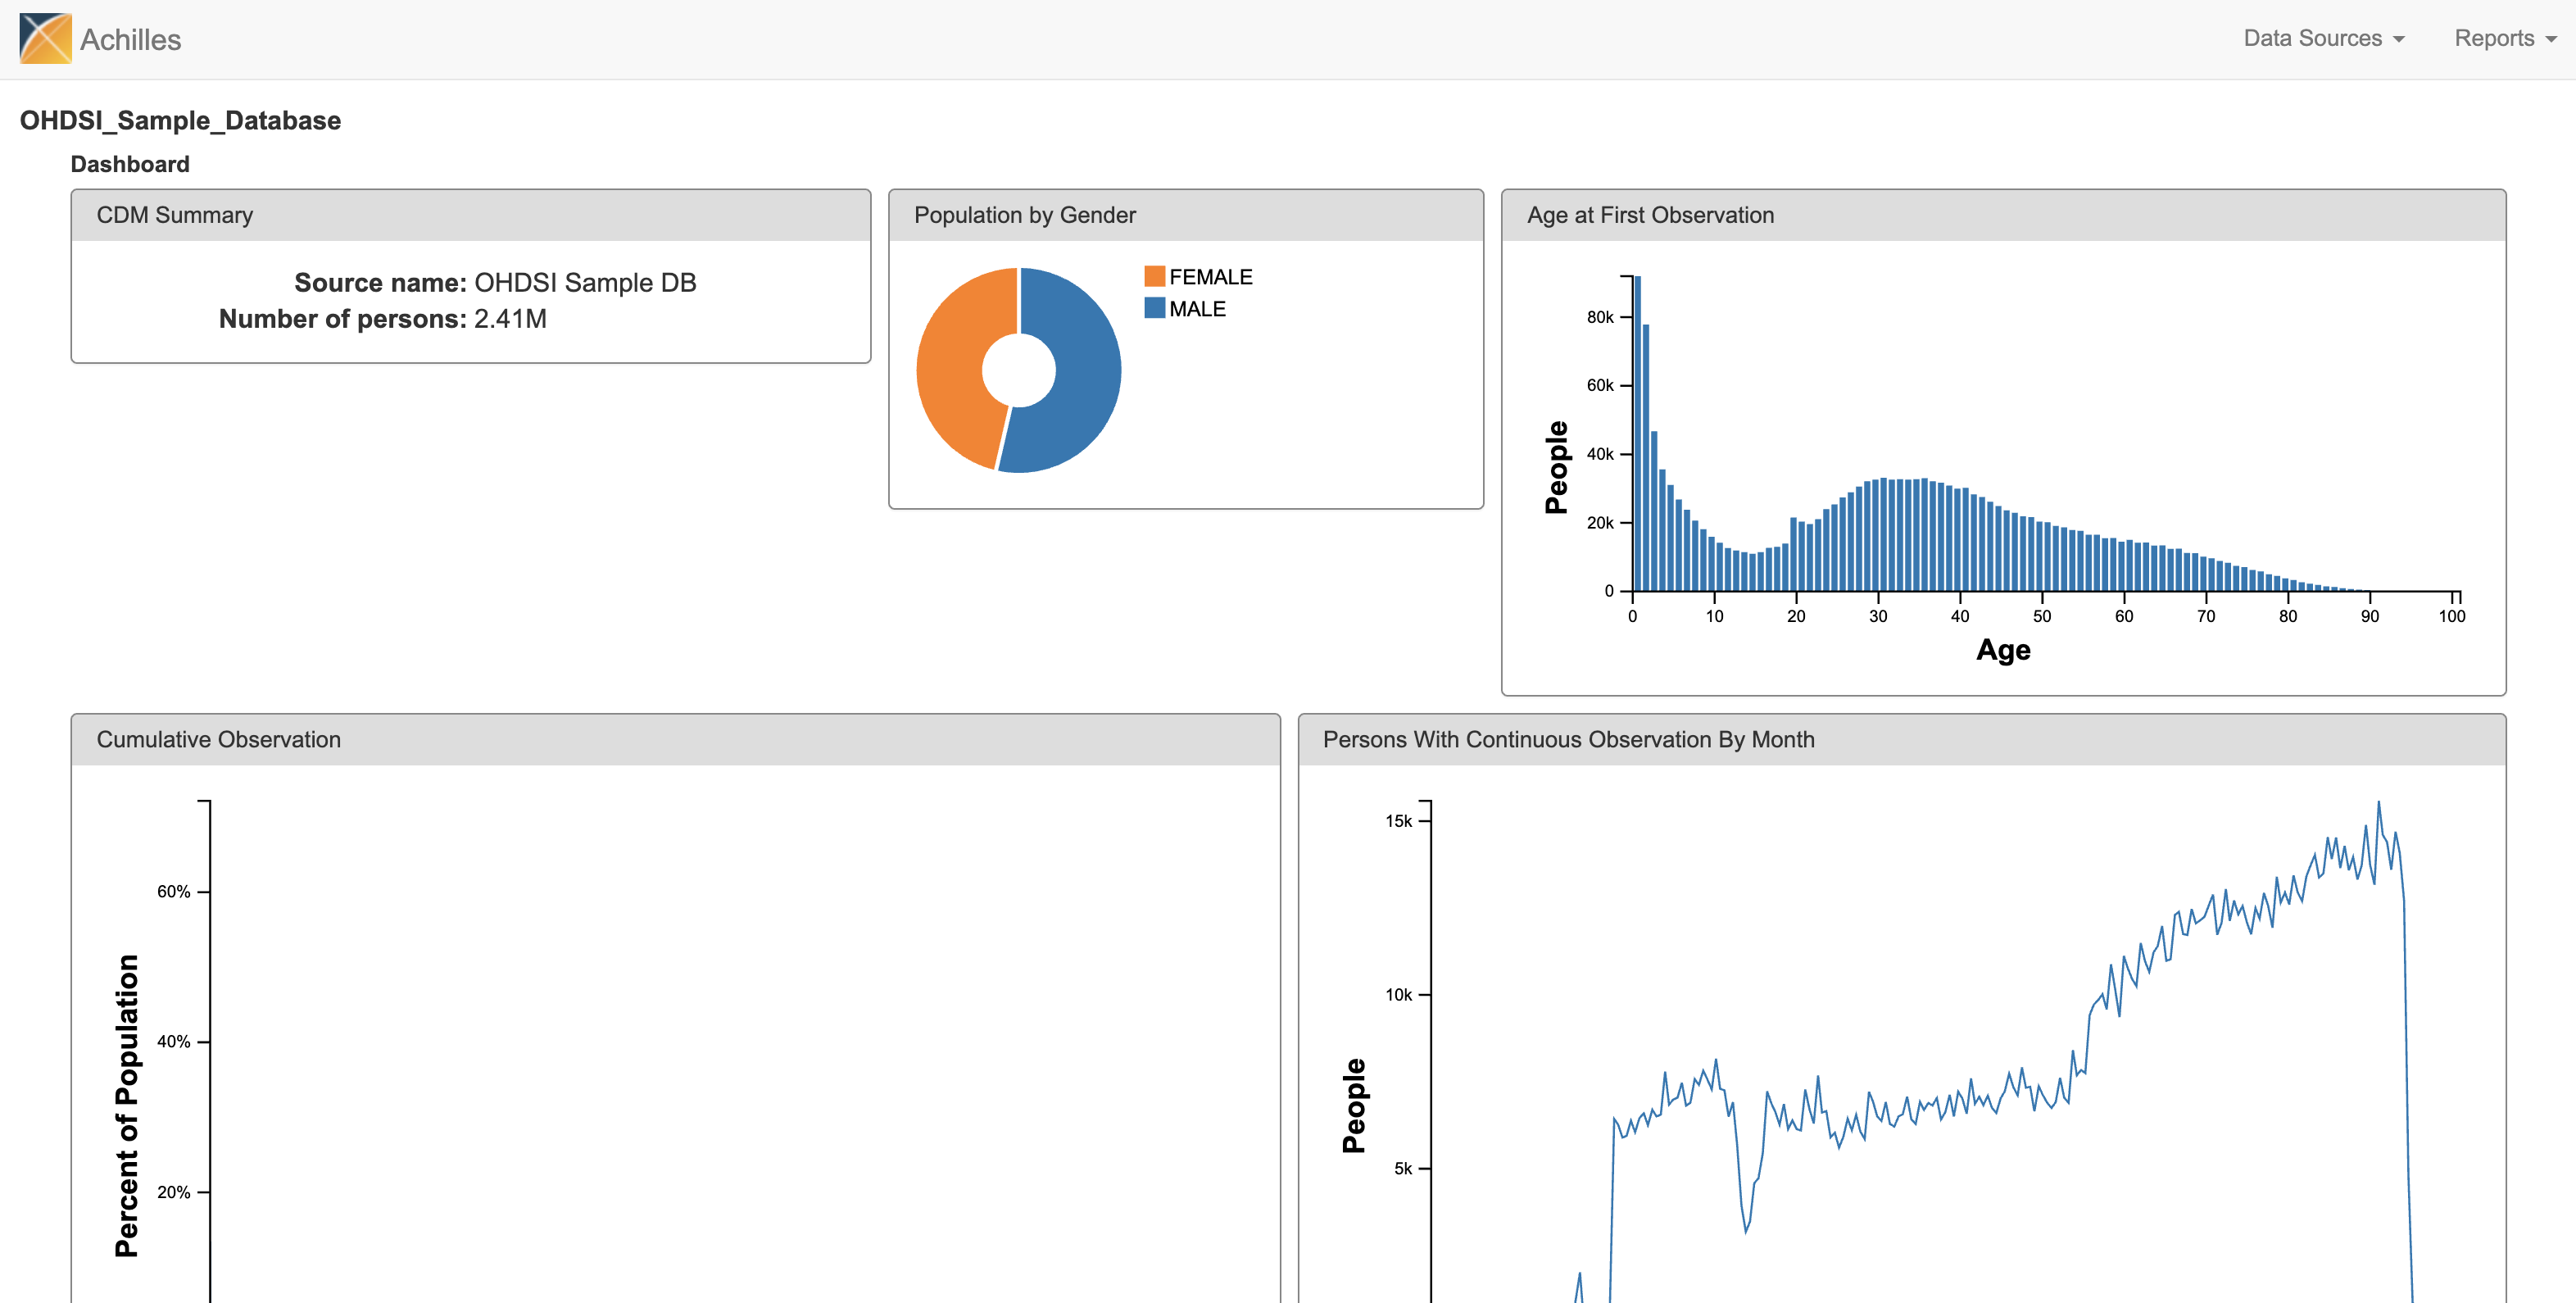
ACHILLES is a software tool that provides for characterization and visualization of a database conforming to the CDM. It can also be a critical resource to evaluate the composition of CDM databases in a network. ACHILLES is an R package, and produces reports based on the summary data it generates in the “Data Sources” function of ATLAS.
ACHILLES LINKS
Documentation: Book of OHDSI – ACHILLES tool and ACHILLES in practice
Demo: Click Here
Installation Information: Click Here
Source Code: GitHub
“10-Minute Tutorial” Video: Click Here
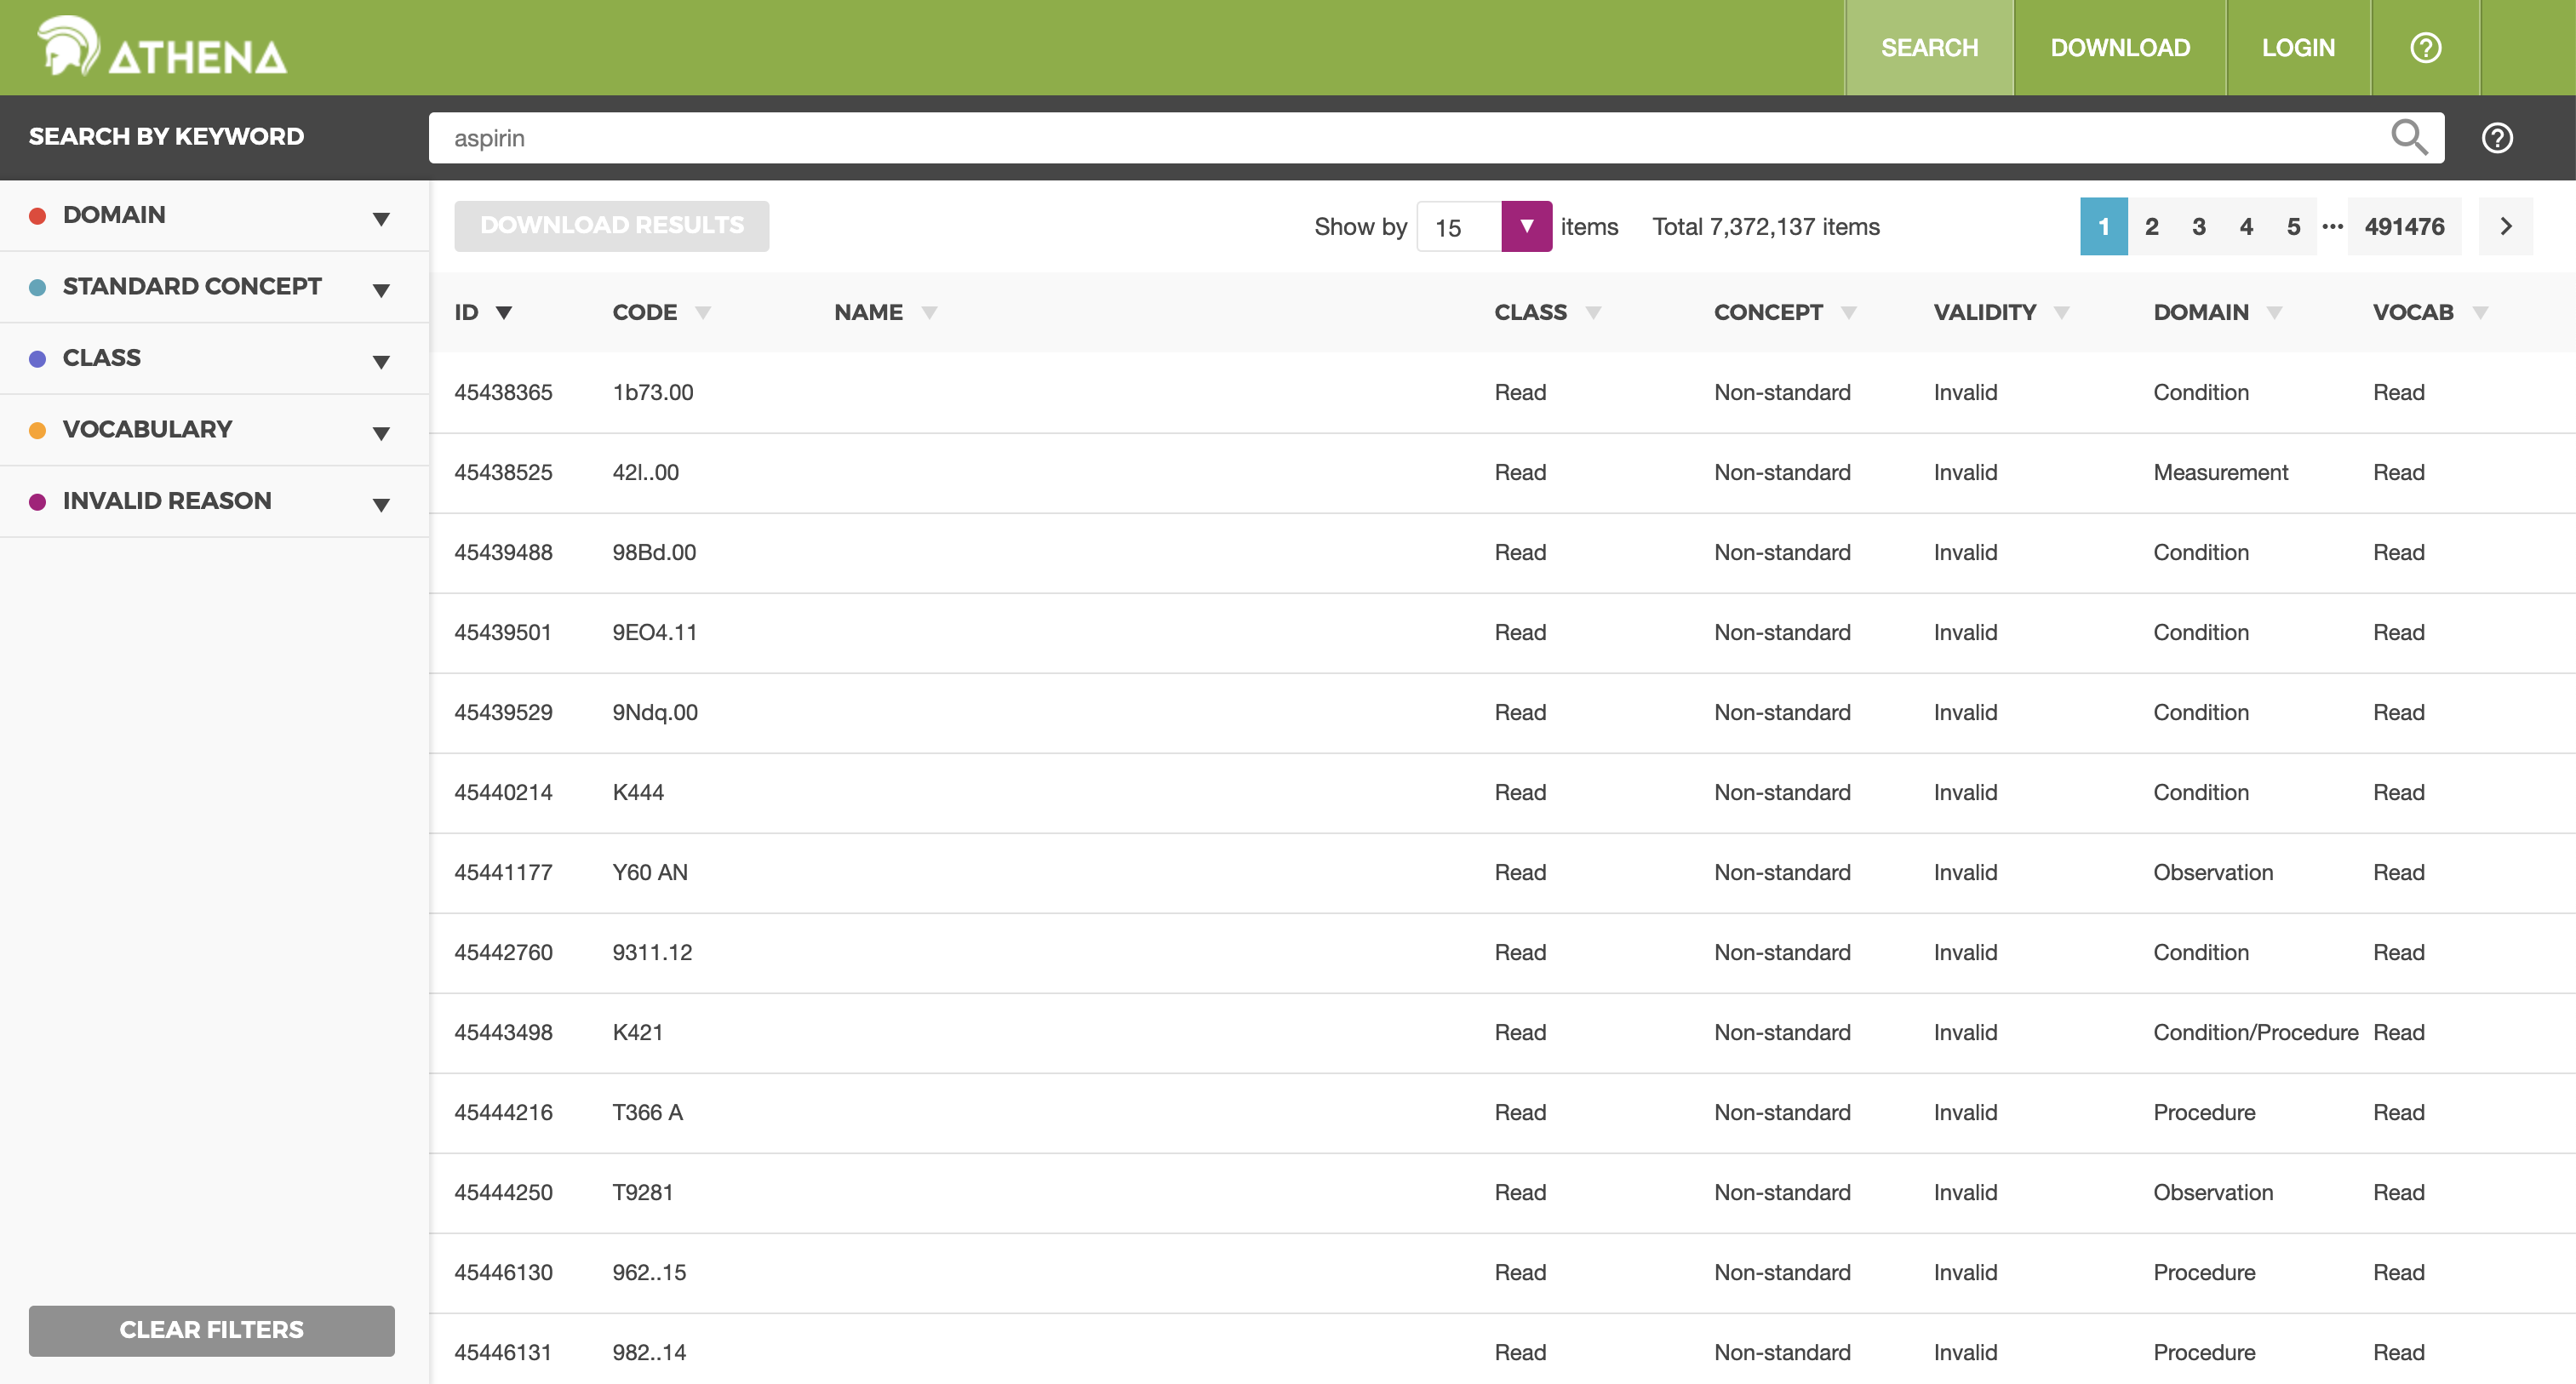 ATHENA allows you to both search and load standardized vocabularies. It is a resource to be used, not a software tool to install. To download a zip file with all Standardized Vocabularies tables select all the vocabularies you need for your OMOP CDM. Vocabularies with standard concepts and very common usage are preselected. Add vocabularies that are used in your source data. Vocabularies that are proprietary have no select button. Click on the “License required” button to incorporate such a vocabulary into your list. The Vocabulary Team will contact you and request you demonstrate your license or help you connect to the right folks to obtain one.
ATHENA LINKS
Vocabularies: Click Here
Source Code: GitHub
“10-Minute Tutorial” Video: Click Here
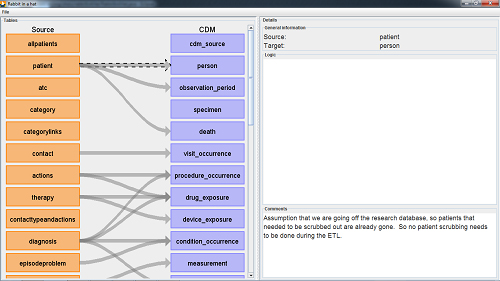 WHITERABBIT and RABBIT-IN-A-HAT are software tools to help prepare for ETLs of longitudinal healthcare databases into the OMOP CDM. WhiteRabbit scans your data and creates a report containing all the information necessary to begin designing the ETL. WhiteRabbit’s main function is to perform a scan of the source data, providing detailed information on the tables, fields, and values that appear in a field. The source data can be in comma-separated text files, or in a database (MySQL, SQL Server, Oracle, PostgreSQL, Microsoft APS, Microsoft Access, Amazon RedShift). The scan will generate a report that can be used as a reference when designing the ETL, for instance by using it in conjunction with the Rabbit-In-a-Hat tool. WhiteRabbit differs from standard data profiling tools in that it attempts to prevent the display of personally identifiable information (PII) data values in the generated output data file.
The Rabbit-in-a-Hat tools that come with the White Rabbit software are specifically designed to support a team of experts in these areas. In a typical setting, the ETL design team sits together in a room, while Rabbit-in-a-Hat is projected on a screen. In a first round, the table-to-table mappings can be collaboratively decided, after which field-to-field mappings can be designed while defining the logic by which values will be transformed.
Rabbit-In-a-Hat is designed to read and display a White Rabbit scan document. White Rabbit generates information about the source data while Rabbit-In-a-Hat uses that information and through a graphical user interface to allow a user to connect source data to tables and columns within the CDM. Rabbit-In-a-Hat generates documentation for the ETL process, it does not generate code to create an ETL.
WHITERABBIT and RABBIT-IN-A-HAT LINKS
Documentation: Book of OHDSI – WhiteRabbit and Rabbit-In-A-Hat • Web Sites – WhiteRabbit and Rabbit-In-A-Hat
Installation Information: WhiteRabbit and Rabbit-In-A-Hat
Source Code: GitHub
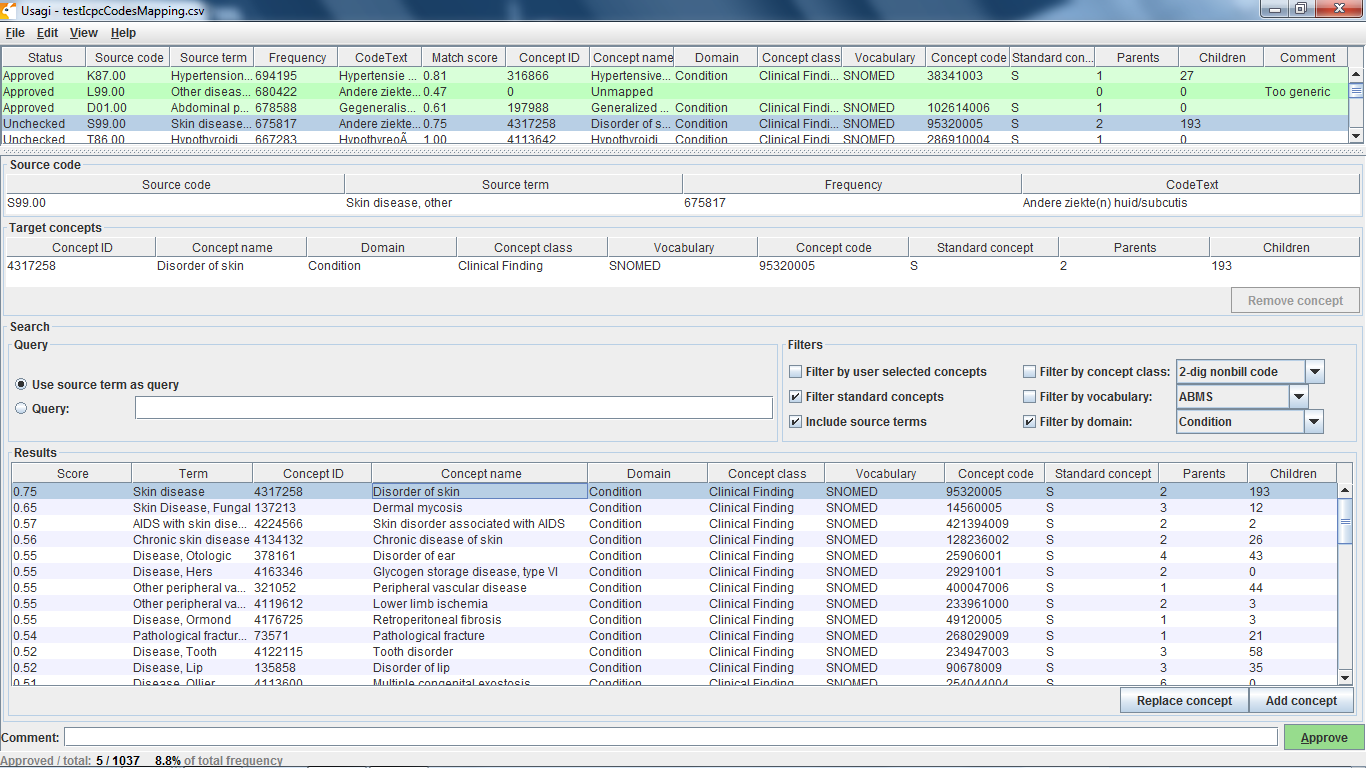 USAGI is a tool to aid the manual process of creating a code mapping. It can make suggested mappings based on the textual similarity of code descriptions. Usagi allows the user to search for the appropriate target concepts if the automated suggestion is not correct. Finally, the user can indicate which mappings are approved to be used in the ETL. Source codes that need mapping are loaded into Usagi (if the codes are not in English additional translations columns are needed). A term similarity approach is used to connect source codes to vocabulary concepts. However, these code connections need to be manually reviewed and Usagi provides an interface to facilitate that. Usagi will only propose concepts that are marked as standard concepts in the vocabulary.
USAGI LINKS
Documentation: Book of OHDSI
Installation Information: Click Here
Source Code: GitHub
“10-Minute Tutorial” Video: Click Here